Your browser doesn't support the features required by impress.js, so you are presented with a simplified version of this presentation.

For the best experience please use the latest Chrome, Safari or Firefox browser.


NETWORK FOR OPEN DEVELOPMENT


Open Data for Development
Happy Birthday

Happy birthday to you
Happy birthday dear Mummy
Happy birthday to you

Is this the best way to achieve your mission?

free to use, reuse and distribute*


* that's what we call open
unlike wine, data
does not
get any better

when it's stored in a dark and cold place

when shared
DATA CAN
provide value


Data shows linear correlation
between
open defecation and child height

Insight in development programs


Crowdsourced data

you are
SURROUNDED BY DATA
and it is getting ever more...

...so you better become
DATA LITERATE

HOW DO YOU GET STARTED?

LEARN


PUBLISH

  1. > Start with what you already publish
  2. > Don't lock it up in PDF
  3. > Show your sources
PLAY

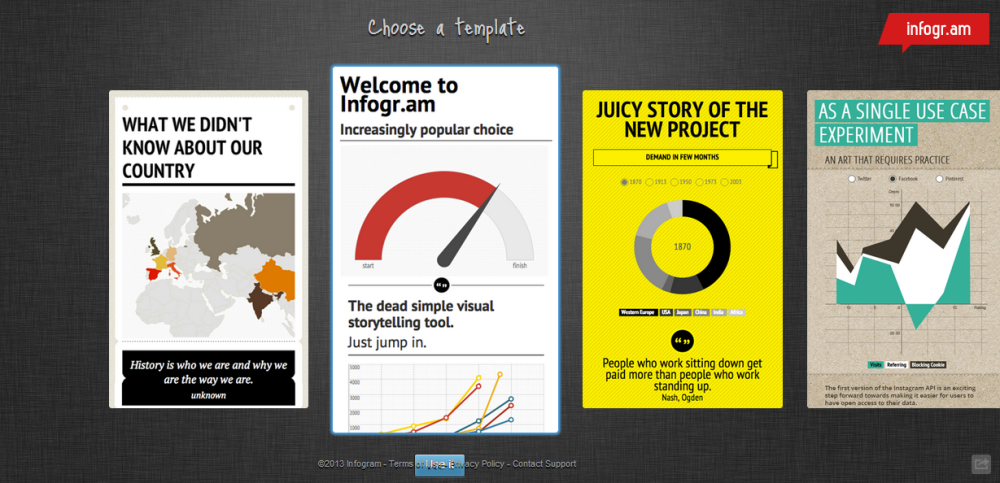
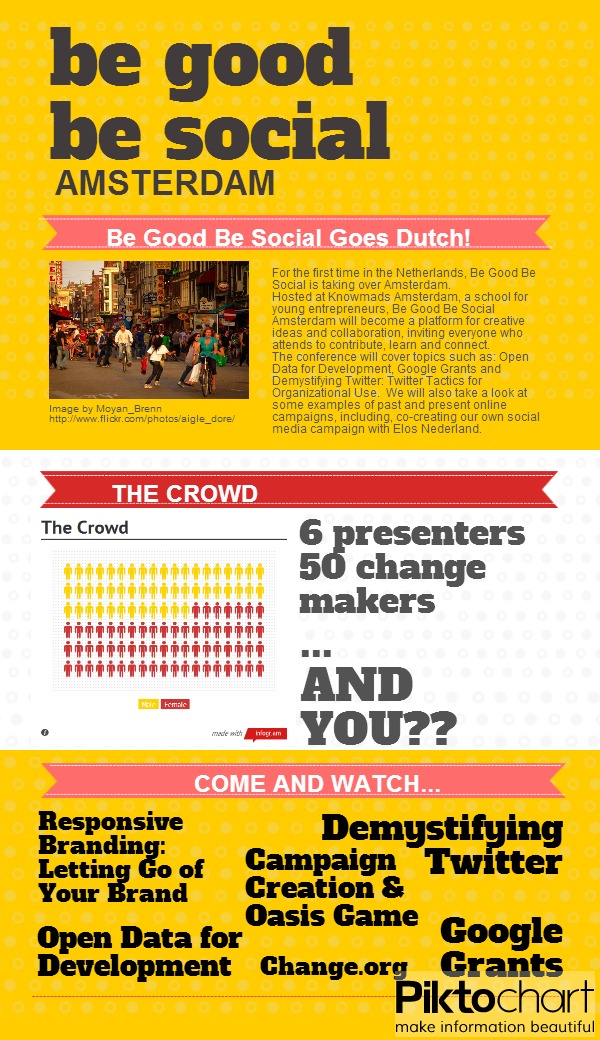
use tools like infogr.am or piktochart.com

Now you know

Be Good
Be Open
Credits
- slide 2, "Happy Birthday Copyright": read a brief history of the copyright on 'Happy Birthday' here, or read a well-documented scholarly article about it here.
- slide 3, Mickey Mouse is © and ® of Disney Corporation. This image is part of the public domain.
- slide 4, Weathering the Storm: Adolescent girls and climate change, Plan International (publication)
- slide 6, opendefinition.org
- slide 7, Wine cellar image by xlibber, http://www.flickr.com/photos/xlibber/3878850962/
- slide 9, "The toilet gap: How much of differences across developing countries in child height can sanitation explain?", image by@pelleaardema
- slide 10, maps.worldbank.org
- slide 11, www.ipaidabribe.com/
Credits #2
- slide 12, "90 percent of the worlds data is only 2 years old": Big data and development: the second half of the chess board
- slide 14, "Get started", image by tableatny, http://www.flickr.com/photos/53370644@N06/4976543720/
- slide 15, School of Data, P2P University, Drawing by Numbers
- slide 17, Infogram, Piktochart. Other sources for data & visualizations: Gapminder, Worldbank and many others.
- slide 18, Example infographic, watch it online on Piktochart.


This presentation was created by Pelle Aardema using Impress.js.
Impress.js was created by @bartaz.
You can find the source on github: https://github.com/bartaz/impress.js/

Use a spacebar or arrow keys to navigate